Benjamin Graham is one of the most legendary investors in history. One of my favorite quotes of his is, “In the short run the stock market is a voting machine, but in the long run it is a weighing machine.” As a value-oriented investor, Graham subscribed to the idea that fundamental analysis of a company will provide insight to an investor as to whether that company will likely produce outsized return of capital in the long run. However, even Graham conceded that the value of a stock solely based on its fundamentals and the agreed upon price of that stock in the open market could deviate for a time. It raised the question: Why does the stock price of a company diverge from the value of that company?
Ultimately, the price of a stock is an agreement between how much a seller is willing to sell that stock for and how much a buyer is willing to pay for it. Since sellers and buyers are human beings and not robots, they can be influenced by factors that are not related to the fundamentals of a company; that is where the divergence arises from. How then does an investor reconcile, or even profit from the difference between the value and the price of a stock? Technical analysis was born from attempting to answer this question. Technical analysis can be summarized as, the study of price action and market statistics, mainly price and number of shares traded (volume), to infer price trends and manage risk. While technical analysis as we know it today was first introduced by Charles Dow and the Dow Theory in the late 1800s, merchants in ancient Babylon kept track of price fluctuations for raw commodities.
Some long-term investors look at technical analysis with contention. Yet, trends between a stock’s price and volume to identify support or resistance levels can be very helpful when deploying capital in the market. These demand-supply dynamics also exist in fixed income, currency, and commodity markets.
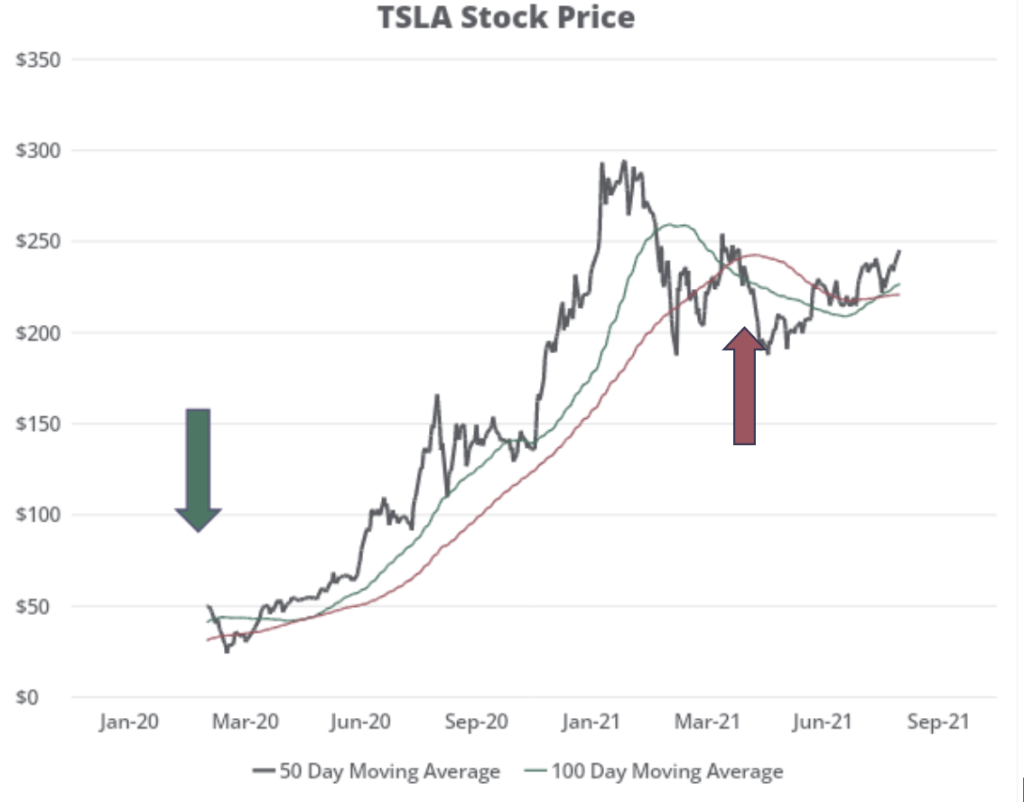
An example of a technical analysis tool that can help determine which direction the price is moving, is a simple moving average crossover. If a shorter moving average (closing price from the last 50 days) crosses above a longer moving average (closing price from the last 100 days), that would be a buy signal (the first arrow). When the shorter moving average crosses below the longer one, that would be a sell signal (the second arrow).
These technical indicators and the signals they produce are not designed to predict the price of a stock, but they can help remove investors’ biases and identify price patterns. The objective is that these tools can help give a clearer picture of price direction in the often murky and unpredictable world of investing.
Technical analysis pairs nicely with fundamental analysis. Sendero uses both as a complement to its robust diligence of managers to assist in the construction, implementation, and monitoring of portfolios. We believe multiple points of view give a more holistic view of what is happening.
The content in this material is provided for informational purposes only and should not be relied upon as recommendations or financial planning advice. We encourage you to seek personalized advice from qualified professionals regarding all personal finance issues. Stock prices presented are historical information and does not guarantee future results. TSLA stock: bloomberg.com