Written by Amaury de Barros Conti, Partner | Chief Investment Officer
What the market record since 1950 does, and does not, tell us about November.
Control of Congress this November comes down to a small number of races. Democrats need a net gain of three seats to take the House and four to take the Senate. Between now and then, you will hear a great deal about what each outcome would mean for your money.
The historical record is worth looking at, and the pages that follow lay it out. The record is also thinner than it sounds. Our view, which the data supports, is that the more useful question is not which party wins but which policies move, and that most of the policies that reach portfolio returns are decided somewhere other than a congressional floor vote.
What is actually on the ballot
All 435 House seats and 35 Senate seats are up on November 3, including two special elections filling the unexpired Ohio and Florida terms. Republicans currently hold 53 Senate seats and a narrow House majority. In midterm elections since the Second World War, the president’s party has lost House seats in 18 of the 20 cycles, the exceptions being 1998 and 2002. A shift in the House would therefore be unremarkable by historical standards.
Where the market already sits matters too. Through September 30, the S&P 500 index had returned roughly 11.8% on a price basis for 2026, already well ahead of the 4.6% full-year average for midterm years since 1950, and it has held that gain through a war, an oil price above $100 a barrel, and inflation that has remained elevated. The S&P 500 index has spent eight months pricing the environment it is operating in, and whatever the election outcome, it will be measured against expectations that are already priced into the markets.
The midterm year has been the weakest performance year of the four-year election cycle
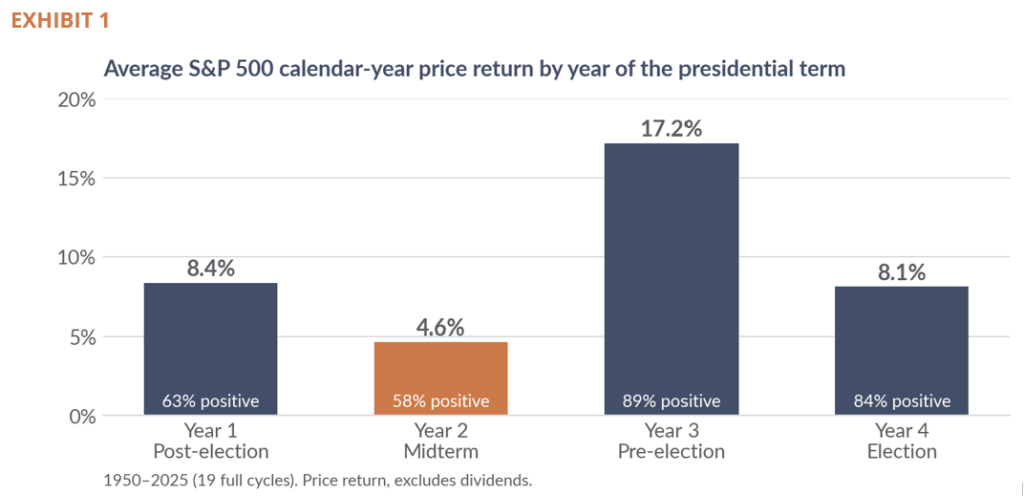
Source: Bloomberg Finance L.P., S&P 500 calendar-year price returns, 1950–2025. Averages and percentage of years with positive returns are Sendero calculations. Price return excludes dividends. Past performance is not indicative of future results.
Sorting every S&P 500 index calendar return year since 1950 by its position in the presidential term produces a consistent pattern. The midterm years have averaged a 4.6% price return against 9.6% for all years, and the annual returns have finished in positive territory only 58% of the time, the lowest of election cycle years. The year that follows has averaged a 17.2% price return and the annual returns have been positive in 17 of 19 cases or 89%. Those two figures are the ones most often quoted in election commentary. They are also averages built on nineteen observations apiece, and the median is harsher than the mean: the median midterm year returned 1.1%.Midterm years tend to carry deeper declines within the year. Strategas Research Partners examined the sixteen midterm cycles from 1962 through 2022 and found that the S&P 500’s average peak-to-trough decline was roughly 19% in midterm years, compared with roughly 13% in the other three years of the presidential cycle1.
Party and control tell you less than you would expect
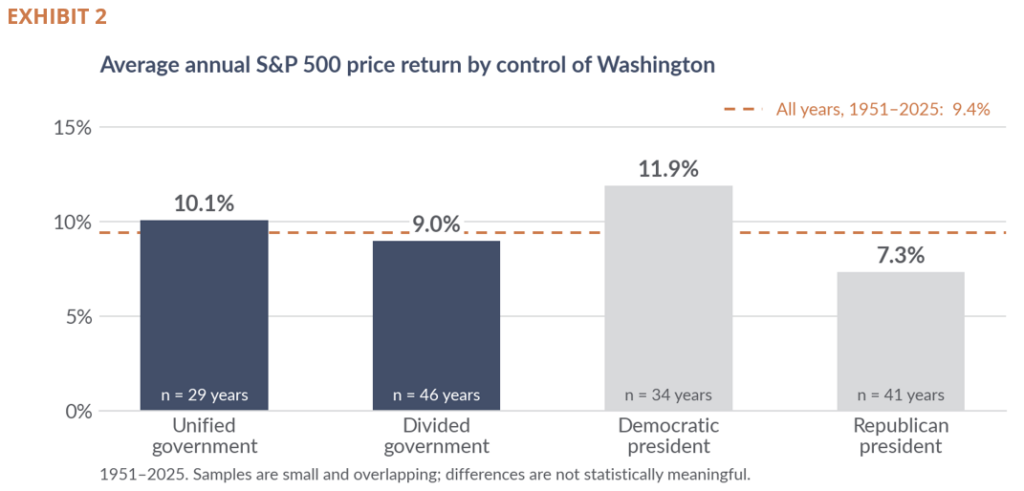
Source: Bloomberg Finance L.P., S&P 500 calendar-year price returns, 1951–2025. Averages and classification of years by party and control of Congress are Sendero calculations. Unified government means the president’s party holds both chambers. Price returns exclude dividends. Past performance is not indicative of future results.
From 1951 through 2025, the S&P 500 index averaged a 10.1% annual price return in years of unified government and 9.0% in years of divided government. Sorted by the president’s party, the gap looks wider: 11.9% under Democratic presidents and 7.3% under Republican presidents. Those figures, however, come from only six stretches of consecutive years for each party rather than from independent annual observations. A single stretch can weigh heavily on the result. The Republican average includes the 2008 financial crisis, and the Democratic average includes the late-1990s bull market. Moving the start date a few years in either direction changes the size of the gap considerably.
The market has advanced under every combination of control in the sample, and in our view the composition of Washington has not been a reliable input to a return forecast.
Where the real questions sit
The election will settle who holds the gavels. It will settle less than you might assume about the policies that reach portfolio returns, and in 2026 the gap between the two is unusually wide. Four areas are worth separating out:
● Trade and tariffs. Tariff policy has been set largely through executive authority and tested in the courts rather than written in legislation. A change in congressional control does not obviously change that path.
● The war with Iran. The conflict is being prosecuted under executive authority. Both chambers passed a concurrent War Powers resolution in June directing an end to United States involvement, and the House passed further resolutions in July and September. Neither has been treated by the administration as binding, and the conflict has continued. November is unlikely to change who decides this. What it reaches in portfolios runs through oil: West Texas Intermediate crossed $100 a barrel in early September for the first time since May. In March, the International Energy Agency characterized the disruption around the Strait of Hormuz as “the largest supply disruption in the history of the global oil market.”2
● Monetary policy. The rate path and the composition of the Federal Reserve are not set by Congress, and in our view they have mattered more to equity and bond returns over most historical periods than the party in power.
● Inflation and the consumer. The August CPI report, released September 11, held headline inflation at 3.4% over the year while core inflation fell to 2.4%, the lowest reading since March 2021. The gap between those two numbers is largely energy. Gasoline was up 27.4% over the year and energy overall 16.3%. That distinction matters more than the headline, because energy and food take a larger share of a lower-income household’s budget than a higher-income household’s. Research published this year by the Federal Reserve Bank of New York found that retail spending growth since 2023 has been driven largely by higher-income households3. A The Federal Reserve Bank of Minneapolis has reported rising loan delinquencies among lower-income borrowers in its region4. In our view, a single inflation print now averages two household experiences that are progressively different, and the same is increasingly true of a single earnings number.
A change in congressional control changes what legislation can pass. That matters at the margin, and it can matter a great deal for a particular sector. The War Powers votes are the cleaner illustration of the limit: both chambers went on record, and the policy did not move. We believe what sets the aggregate direction of earnings, interest rates, and valuations sits largely outside the result on November 3, and those forces drive the bulk of a diversified portfolio’s return.
Sources
1Strategas, “Deeper Corrections but Stronger Recoveries in Midterm Years”, Washington policy Research, May 13, 2022.
2Source: International Energy Agency, Oil Market Report – March 2026, March 12, 2026.
3Chakrabarti, Pham, Pierce, and Pinkovskiy, “Tracking the K-Shaped Economy: Who’s Driving Spending?,” Federal Reserve Bank of New York, Liberty Street Economics, May 1, 2026.
4Cramer, Horowitz, Narayan, Tchourumoff, and Xu, “Lower-income Minnesotans struggle in uncertain economy,” Federal Reserve Bank of Minneapolis, July 17, 2026.
Data and methodology. Index returns are S&P 500 calendar-year price returns from Bloomberg Finance L.P. and exclude dividends. Returns before 1957 reflect the predecessor S&P 90 index, which data providers may splice differently. Sendero calculated the averages by year of the presidential term, by control of government, and by party of the president shown in Exhibits 1 and 2 and in the text. Exhibit 1 covers 1950–2025 (19 full presidential cycles). Exhibit 2 covers 1951–2025 so that it lines up with congressional terms, which begin in odd-numbered years; 2001 is classified as divided government. The year-to-date S&P 500 return is through September 22, 2026. Congressional seat counts and crude oil prices are as of September 10, 2026. Third-party sources are cited in the notes. Views are as of September 2026.
General Disclaimer: This material is provided for informational purposes only and should not be construed as investment, legal, or tax advice. Sendero Wealth Management, LLC is an SEC-registered adviser; registration does not imply skill. Views are as of the date noted, may change without notice, and forward-looking statements are not guarantees of future results. Data from third-party sources is believed to be reliable but is not guaranteed; indices are unmanaged and not available for direct investment. Past performance is not indicative of future results. All investments involve risk, including possible loss of principal. Sendero Wealth Management does not provide tax or legal advice. Consult your professional advisers regarding your specific circumstances. Review our Form ADV & Form CRS at www.sendero.com.
Investment advisory services are provided by Sendero Wealth Management, LLC, a registered investment advisor. Alternative investments may be offered through Sendero Securities, LLC, a broker-dealer and member FINRA/SIPC, an affiliate of Sendero Wealth Management, LLC. Non-investment advisory services, including family office, philanthropic, Women’s Initiative and Family Engagement advisory services are provided through Sendero Family Enterprise, LLC, which does not provide investment management services.