Written by Amaury de Barros Conti, Partner | Vice President Investments
WHAT MOVED MARKETS LAST WEEK
Financial markets experienced an abrupt increase in volatility as investors reassessed the durability of the artificial-intelligence capital-spending cycle and the potential policy implications of the U.S. midterm elections. A sharp technology-led decline on Thursday spread into global equities before a partial rebound on Friday. At the same time, a stronger-than-expected employment report reinforced the economy’s resilience and increased expectations for another Federal Reserve rate increase in December. The S&P 500 fell 2.7% for the week, the Nasdaq Composite declined 3.4%, and the Dow Jones Industrial Average lost 0.9%, as per Bloomberg data.
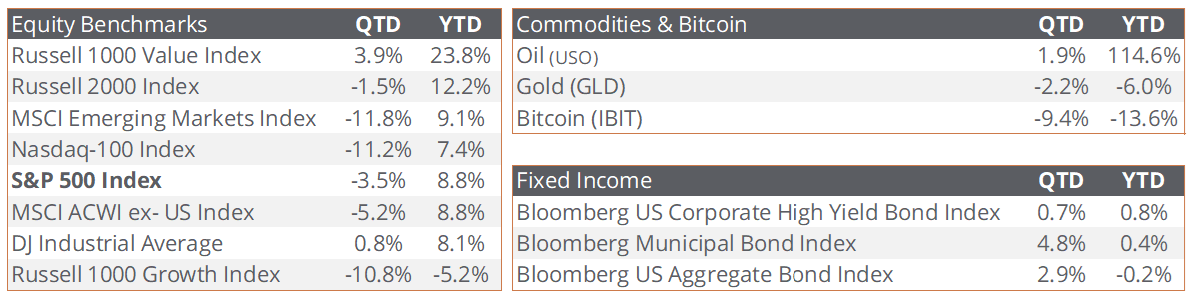
- The selloff was global, but style leadership remained differentiated. Asian technology markets absorbed the sharpest spillover, with South Korea’s KOSPI and Japan’s Nikkei 225 each falling roughly 6% on Friday and Taiwan’s Taiex down about 4.5%. In the United States, Russell 1000 Growth declined approximately 5.0% for the week, compared with a 0.5% decline for Russell 1000 Value. Real estate gained about 2% for the week, offering another indication that the week represented a rotation away from long-duration growth exposure rather than a uniform rejection of all risk assets.
- Bonds provided diversification as oil prices retreated. Brent crude fell from nearly $113 to about $98 per barrel, while WTI ended near $91, as reports of potential U.S.-Iran discussions reduced the geopolitical risk premium.
- October payrolls increased by 165,000, well above expectations near 60,000 to 70,000. The unemployment rate declined to 4.1%, average hourly earnings rose 0.4% for the month and 3.1% from a year earlier, and prior payroll estimates were revised higher by a combined 84,000.
LOOKING AHEAD
- The November 3 midterm elections will be the week’s primary policy event, with potential implications for fiscal policy, regulation, defense, health care, financials, and digital assets. Markets will also monitor whether the election outcome alters the expected path of deficits or Treasury issuance. Historically, post-election market results have varied widely, and we believe the economic and earnings backdrop has generally mattered more than the party composition of Congress.
- Inflation data will be the primary macro catalyst. October CPI is scheduled for November 10, with consensus expectations near 0.3% month over month and 3.7% year over year for headline inflation and approximately 0.2% monthly core inflation. Producer prices, jobless claims, existing-home sales, and small-business sentiment will provide additional evidence on pricing pressure and domestic demand.
- Earnings will test the AI and credit narratives. Results from CoreWeave, Cisco, Applied Materials, Brookfield, KKR, and other companies will offer insight into data-center demand, semiconductor capital spending, networking activity, and private-market conditions. Investors are likely to focus on free cash flow, financing requirements, backlog quality, and returns on invested capital rather than revenue growth alone.

Amaury de Barros Conti
Partner | Vice President Investments
Source: Equity index returns, Asian market moves, consensus CPI estimates, producer prices, jobless claims, existing-home sales, and small-business sentiment: Bloomberg; oil prices and U.S.-Iran reports: Reuters; October payrolls, unemployment rate, average hourly earnings, and payroll revisions: Bureau of Labor Statistics; Federal Reserve rate expectations: CME FedWatch; October CPI release date: Bureau of Labor Statistics; earnings commentary (CoreWeave, Cisco, Applied Materials, Brookfield, KKR): CNBC. Data is provided as of November 6, 2026 unless otherwise stated. Commodities & Crypto returns are represented by ETFs (ticker provided above), used as proxies where the exposure is not directly investable index returns are not available. ETF returns reflect total price return with distributions reinvested and are net of each fund’s operating expenses; the index returns shown elsewhere on this page are gross of fees, so the two are not directly comparable. QTD reflects returns from October 1 through November 6, 2026 and YTD reflects January 1 through November 6, 2026.
General Disclaimer: This material is provided for informational purposes only and should not be construed as investment, legal, or tax advice. Sendero Wealth Management LLC is an SEC-registered adviser; registration does not imply skill. References to specific securities are for informational purposes and do not constitute a recommendation to buy, sell, or hold any security. Views are as of the date noted, may change without notice, and forward-looking statements are not guarantees of future results. Data from third-party sources is believed to be reliable but is not guaranteed; indices are unmanaged and not available for direct investment. Past performance is not indicative of future results. All investments involve risk, including possible loss of principal. Consult your professional advisers regarding your specific circumstances. Review our Form ADV & Form CRS here.